Inputs and Outputs
This section will cover the inputs and outputs used in iPool and Apollo.
Overview
iPool and Apollo utilize and analyze a variety of data inputs and outputs. Inputs include regional demand, regional generation, bid offers, and events, while outputs include summary reports, charts, the reports tab, and CSV-format reports. These inputs and outputs are essential for conducting market analysis. The outputs consist of various chart and form that provides additional insight on the market analysis.
Input Data Files Overview
There are four primary inputs:
- Demand
- Generation
- Bid offers
- Events
Three of these inputs—demand, generation and bid offers—are required to run the simulation.
The outage events input is optional, but it is important for achieving accuracy.
| Input Type | Content |
|---|---|
| Region Demand | MW demand for each dispatch interval of each region |
| Region Generation | MW generation for each dispatch interval of each region |
| Bid Offer | Bids for each dispatch interval of each site or unit |
| Planned Events | Outages and deratings of units, stations, and links |
| iPool Database | Operational data (pool, regions, stations, units, links) |
| WESM Files | Includes all the necessary data for running historical load and simulations |
Input Format and Default Folder
| Input Type | Format | Required? | Default Folder |
|---|---|---|---|
| Region Demand | CSV | ✅ Yes | C:\IENERGY\WESMXXXX\Demands |
| Region Generation | CSV | ✅ Yes | C:\IENERGY\WESMXXXX\Generations |
| Bid Offer | Bid file | ✅ Yes | C:\IENERGY\WESMXXXX\Bids |
| Planned Events | CSV | ⚠️ Optional | C:\IENERGY\WESMXXXX\Events |
| iPool Database | MS Access | Core DB | C:\IENERGY\WESMXXXX\Databases |
| WESM Files | CSV | ✅ Yes | C:\IENERGY\WESM FILES |
WESM Files
- Real-Time Data
- Week-Ahead Projection
- Day-Ahead Projection
| File Name | Description | Directory Location |
|---|---|---|
| RTD | Unit Generation & Load Demand, Price (LMP & SMP) & MLF | C:\IENERGY\WESMXXXX\WESM FILES\RTD |
| RTDOR | Reserve Bid Offers (Dr, Ru, Rd, Dr) | C:\IENERGY\WESMXXXX\WESM FILES\RTDOR |
| RTDOE | Energy Bid Offers | C:\IENERGY\WESMXXXX\WESM FILES\RTDOE |
| RTDHS | Link Flows | C:\IENERGY\WESMXXXX\WESM FILES\RTDHS |
| RTDRS | Reserve Schedules | C:\IENERGY\WESMXXXX\WESM FILES\RTDRS |
| MP | Marginal Unit | C:\IENERGY\WESMXXXX\WESM FILES\MP |
| RTDOPRSVSUMM | Reserve Prices | C:\IENERGY\WESMXXXX\WESM FILES\RTDOPRSVSUMM |
| File Name | Description | Directory Location |
|---|---|---|
| WAP | Week-ahead Projection | C:\IENERGY\WESMXXXX\WESM FILES\WAP |
| WAPHS | Link Flows | C:\IENERGY\WESMXXXX\WESM FILES\WAPHS |
| WAPOPRSVSUMM | Reserve Prices | C:\IENERGY\WESMXXXX\WESM FILES\WAPOPRSVSUMM |
| WAPOS | Week-ahead Projection Outage Schedule | C:\IENERGY\WESMXXXX\WESM FILES\WAPOS |
| WAPHL | HVDC Limits Imposed | C:\IENERGY\WESMXXXX\WESM FILES\WAPHL |
| File Name | Description | Directory Location |
|---|---|---|
| DAP | Day-ahead Projection | C:\IENERGY\WESMXXXX\WESM FILES\DAP |
| DAPHS | Link Flows | C:\IENERGY\WESMXXXX\WESM FILES\DAPHS |
| DAPOPRSVSUMM | Reserve Prices | C:\IENERGY\WESMXXXX\WESM FILES\DAPOPRSVSUMM |
| DAPOS | Day-ahead Projection Outage Schedule | C:\IENERGY\WESMXXXX\WESM FILES\DAPOS |
| DAPHL | HVDC Limits Imposed | C:\IENERGY\WESMXXXX\WESM FILES\DAPHL |
Output Data Files Overview
iPool simulation results are displayed in the user interface and in output files within the scenario folder. The Summary Report is shown in the browser tab when the root tree item (the scenario object) is selected. For each iPool object in the tree interface, simulation results are available in both the Chart tab and the Report tab.
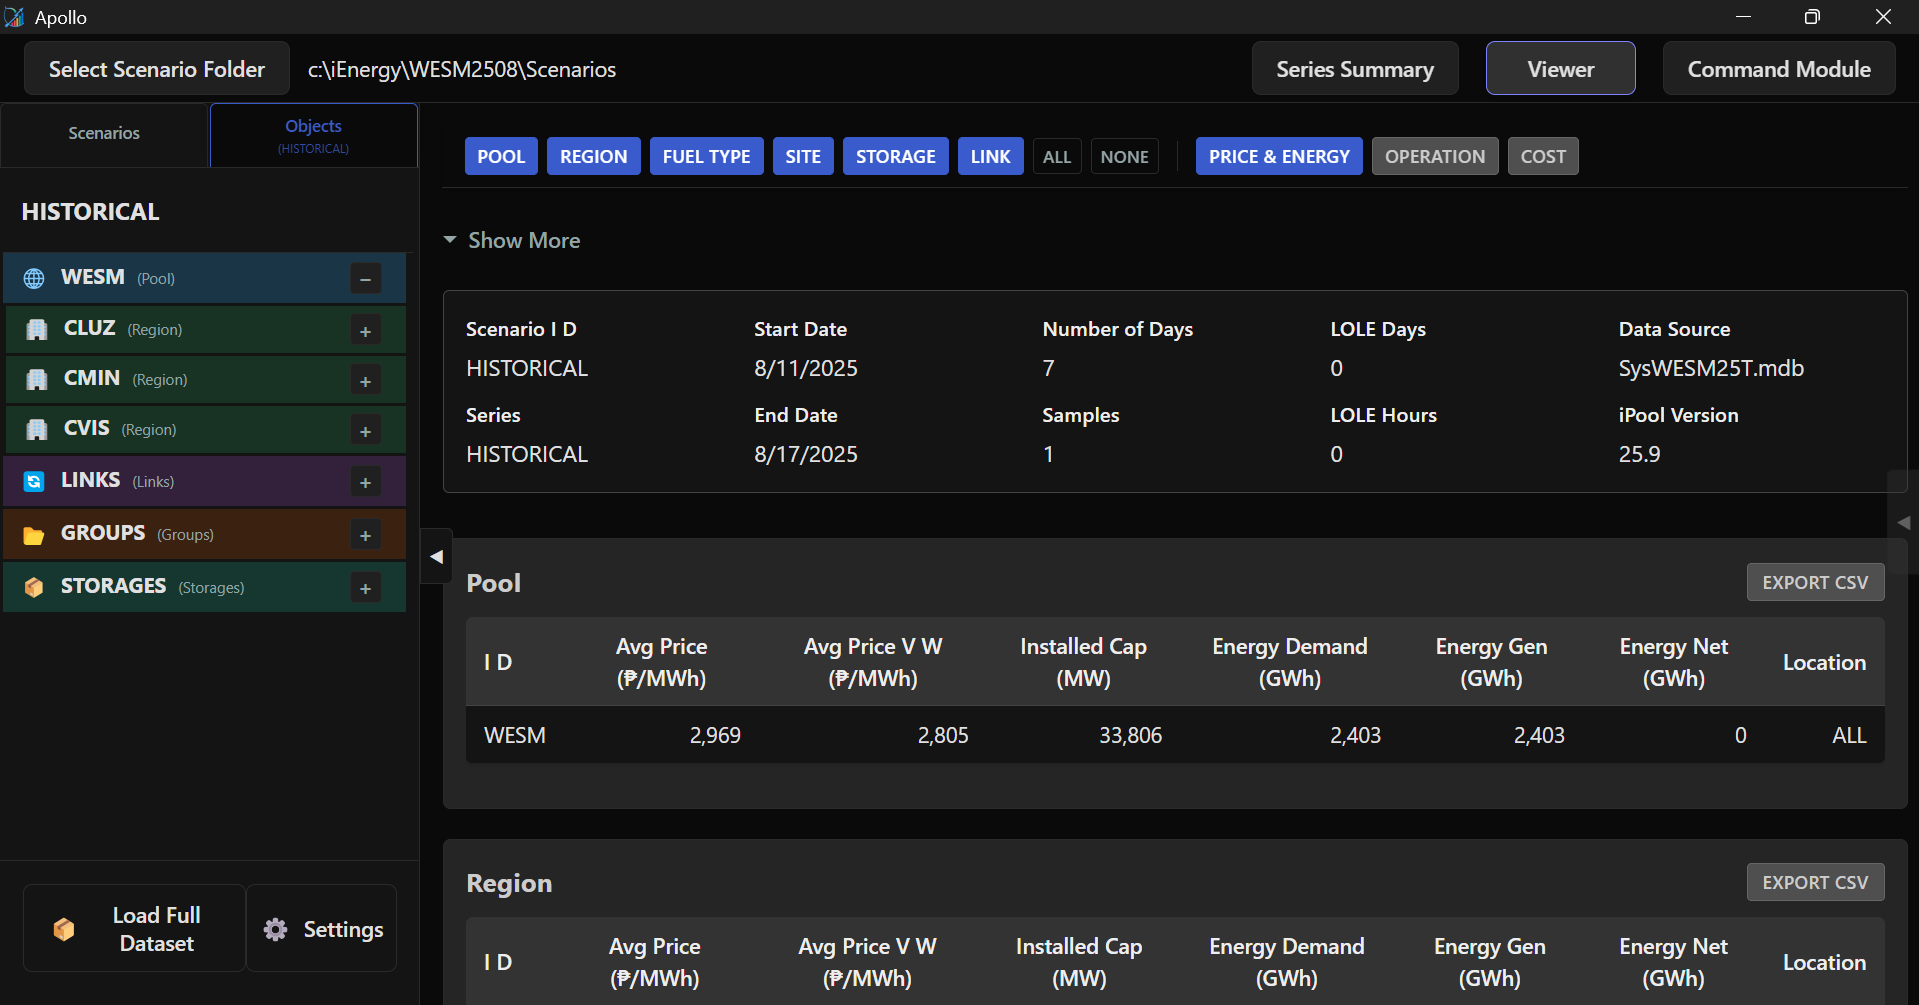
These results are also generated as CSV files in the Scenarios folder. Additionally, users can use Apollo to access the results for advanced chart customization and to enable the Comparison View.
- iPool
- Apollo
- Summary Report
- Chart Tab
- Report Tab
- Demonstration
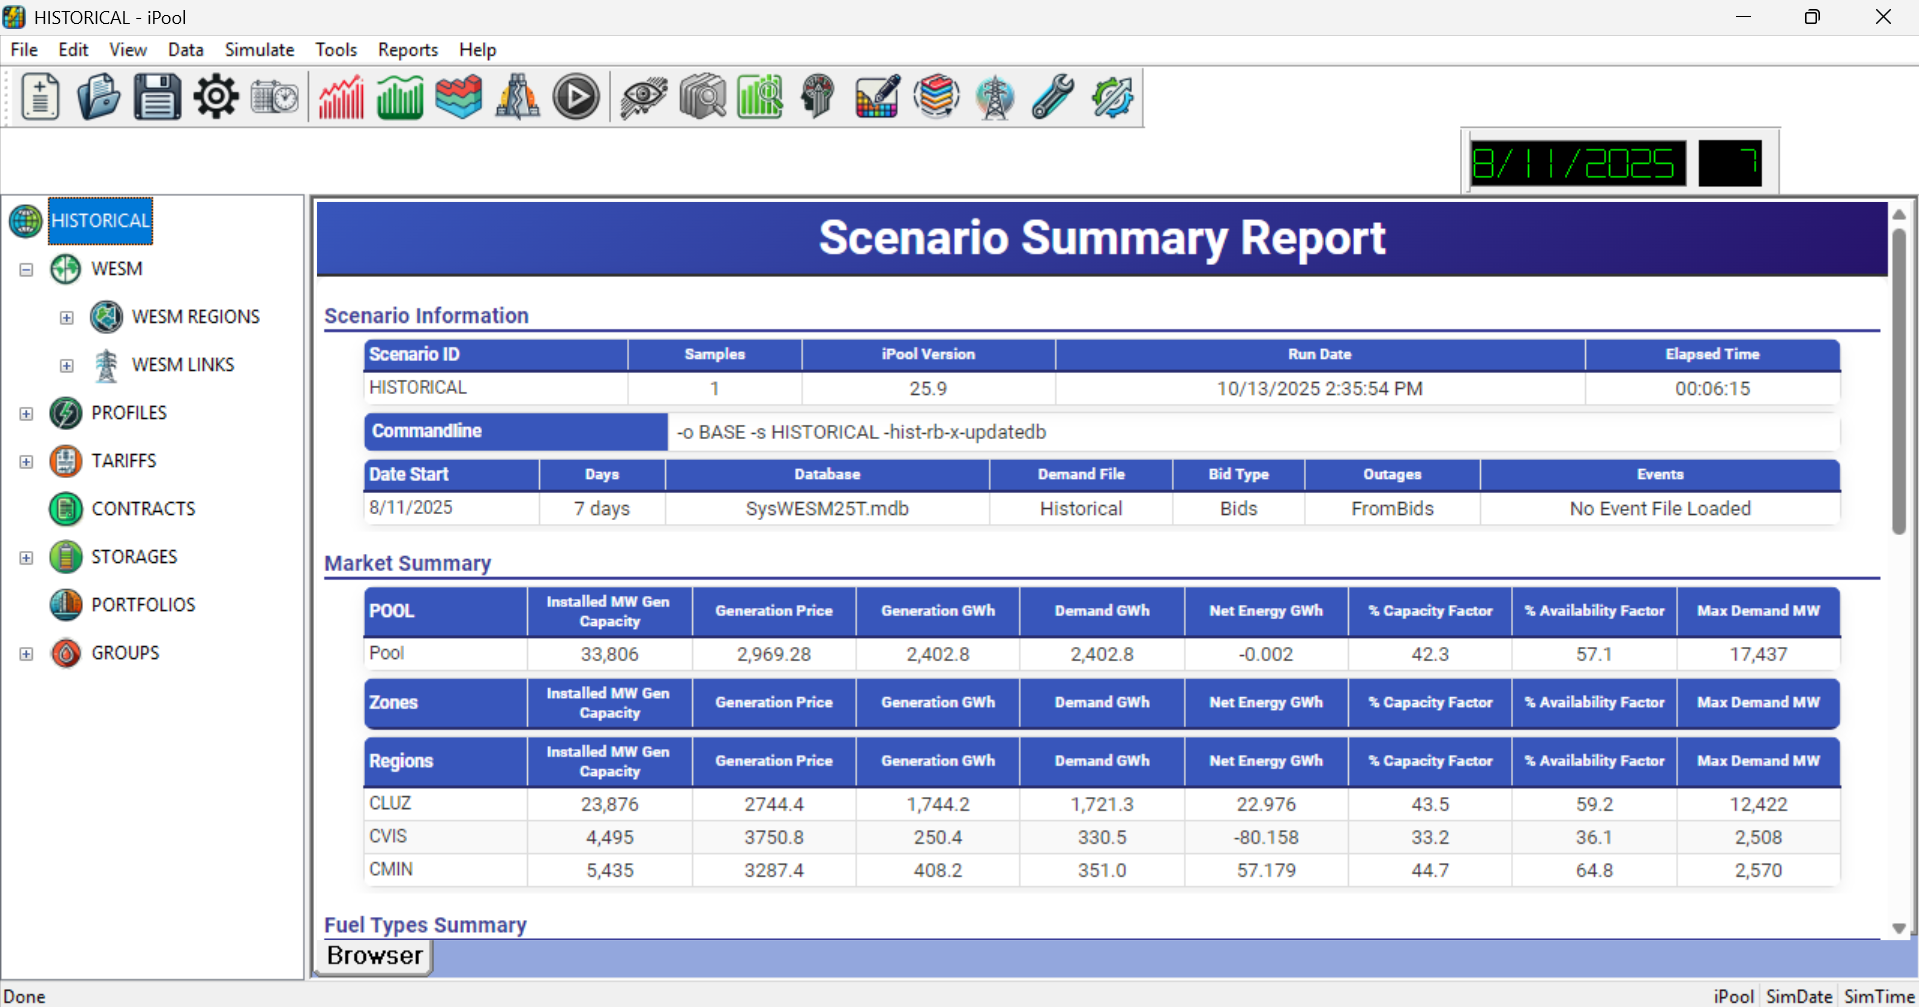
Displays the market information for specific dates.
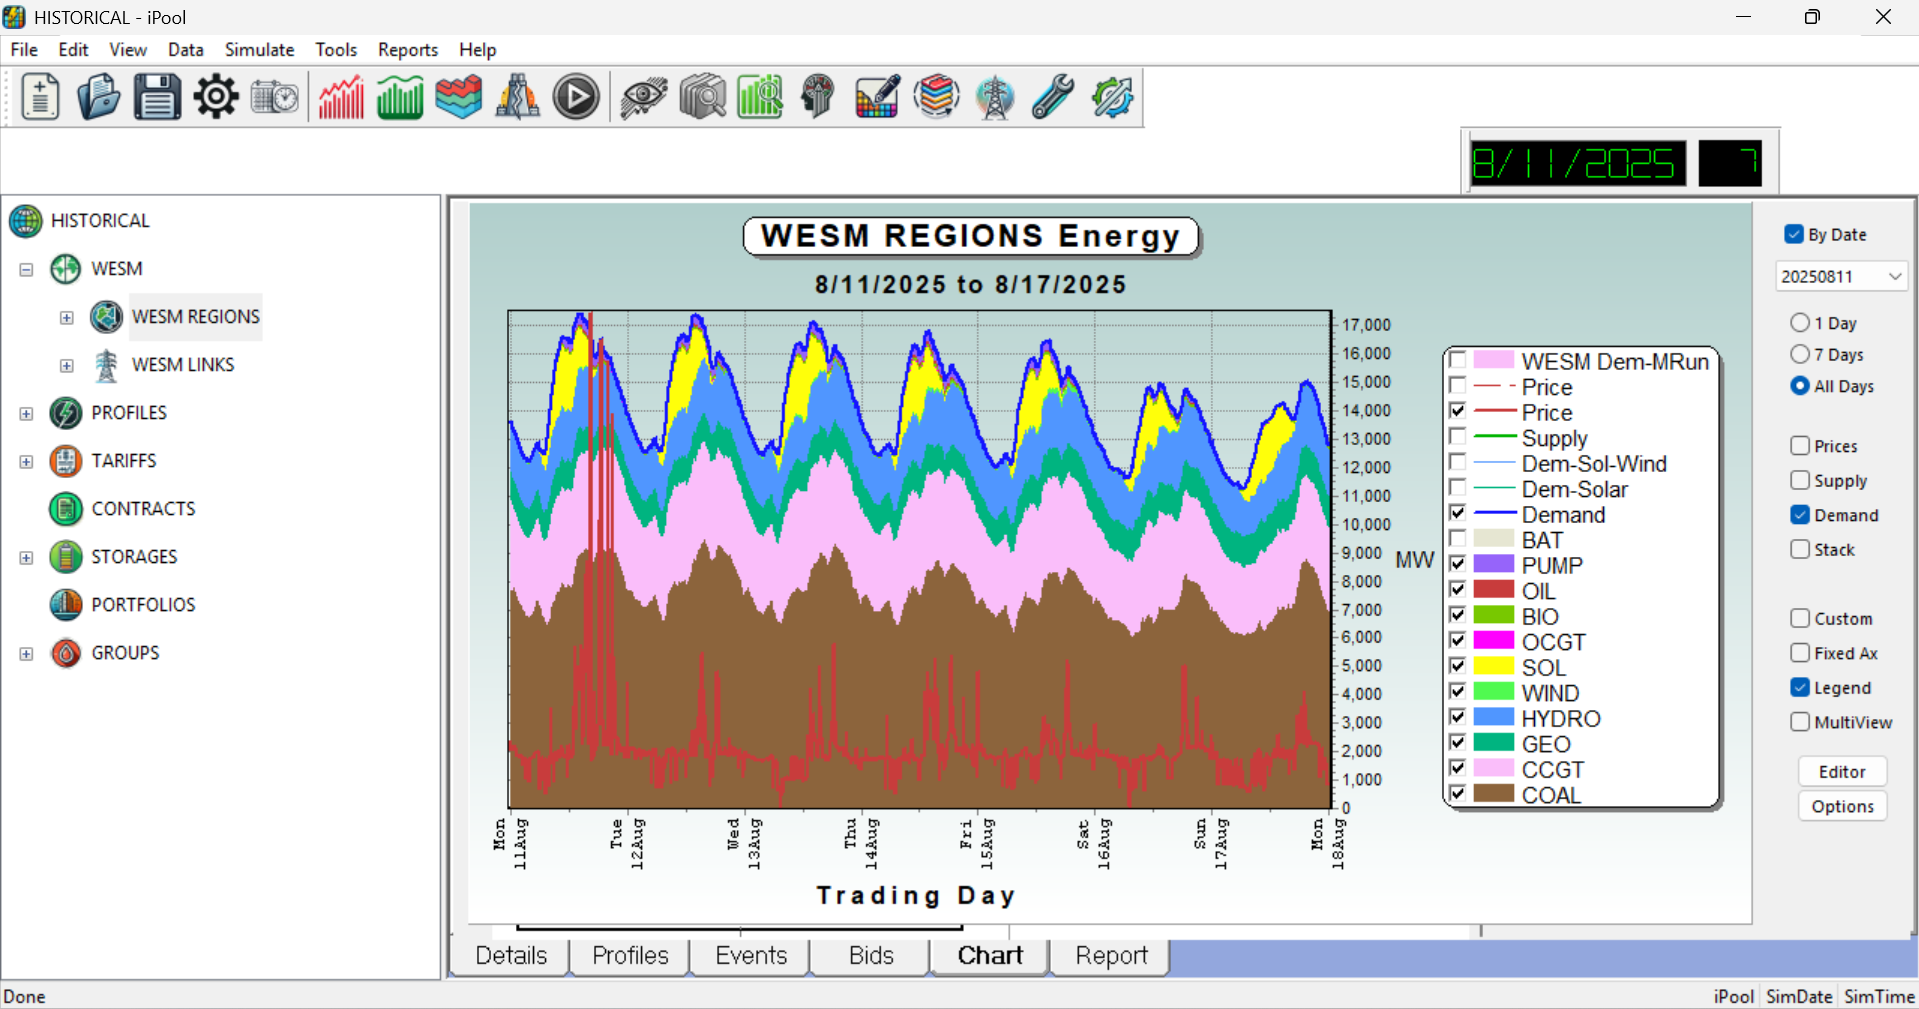
Shows chart for different market parameters such as the supply, demand and fuel stack.
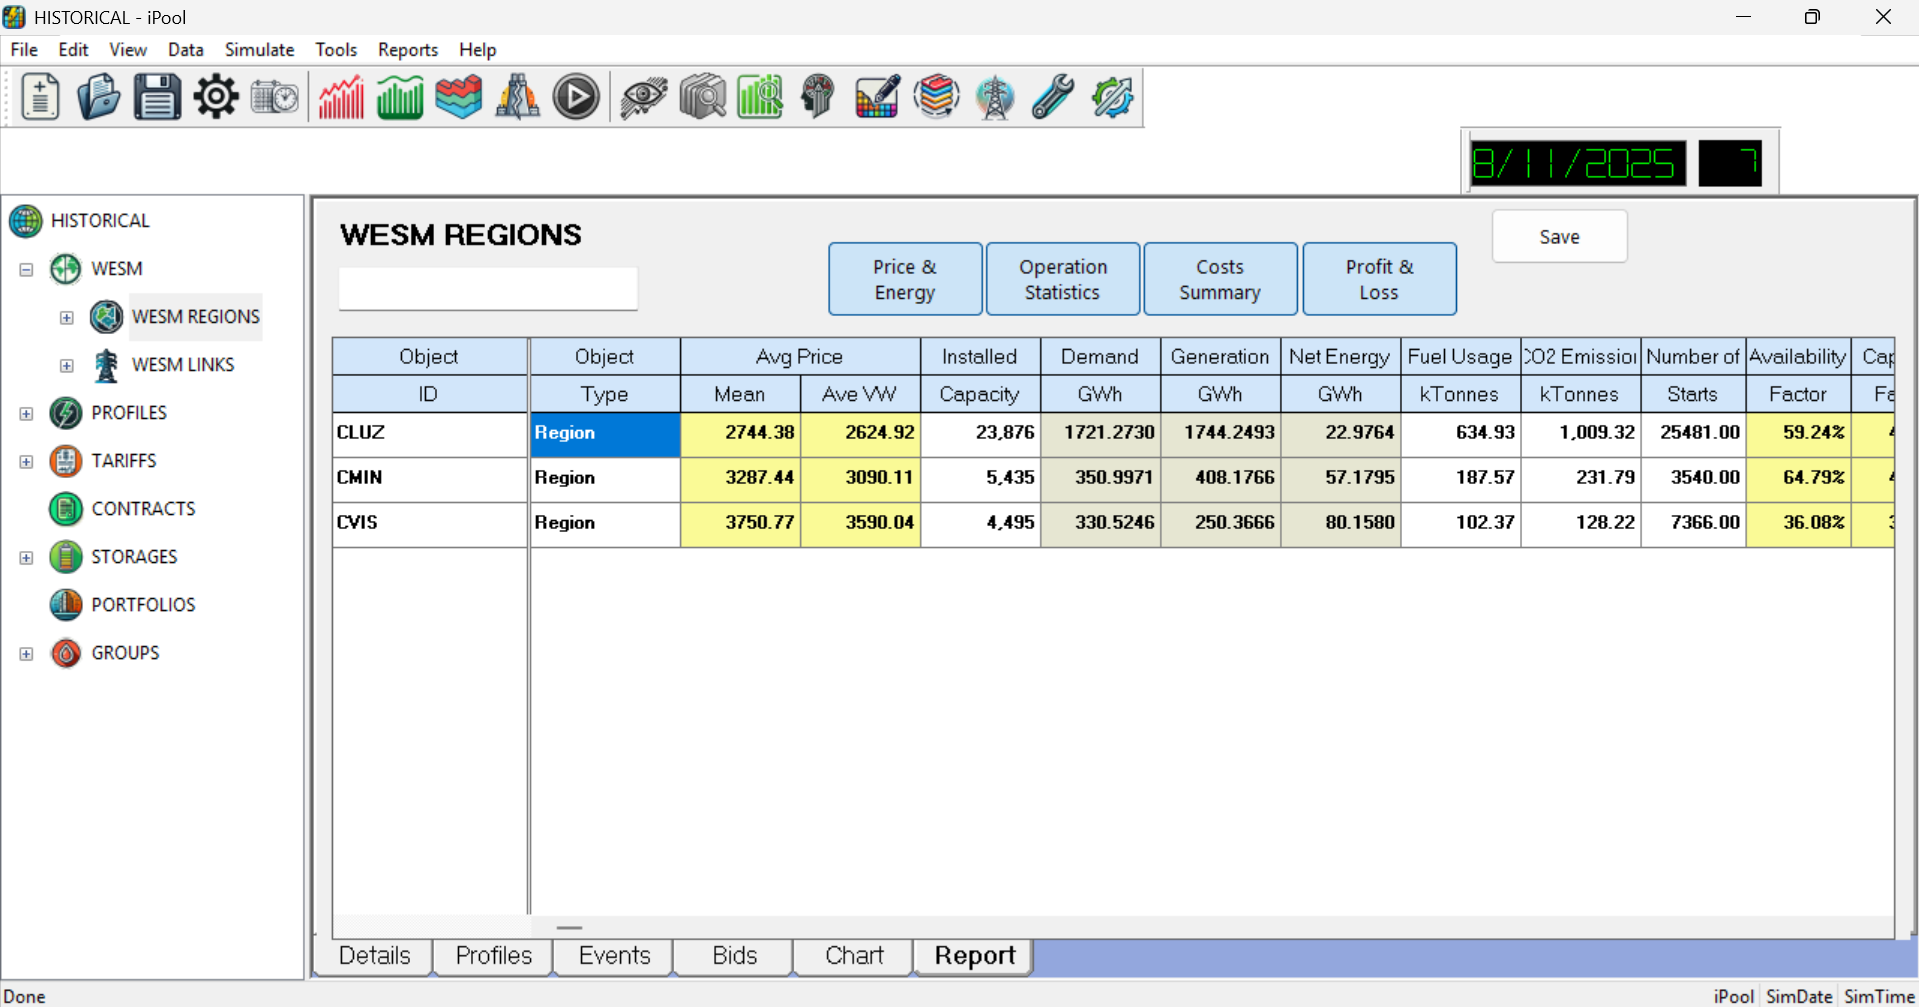
Shows report on the price, energy, costs and other market parameter.
- Summary Report
- Chart Tab
- Comparison View
- Series Summary Analysis
- Demonstration
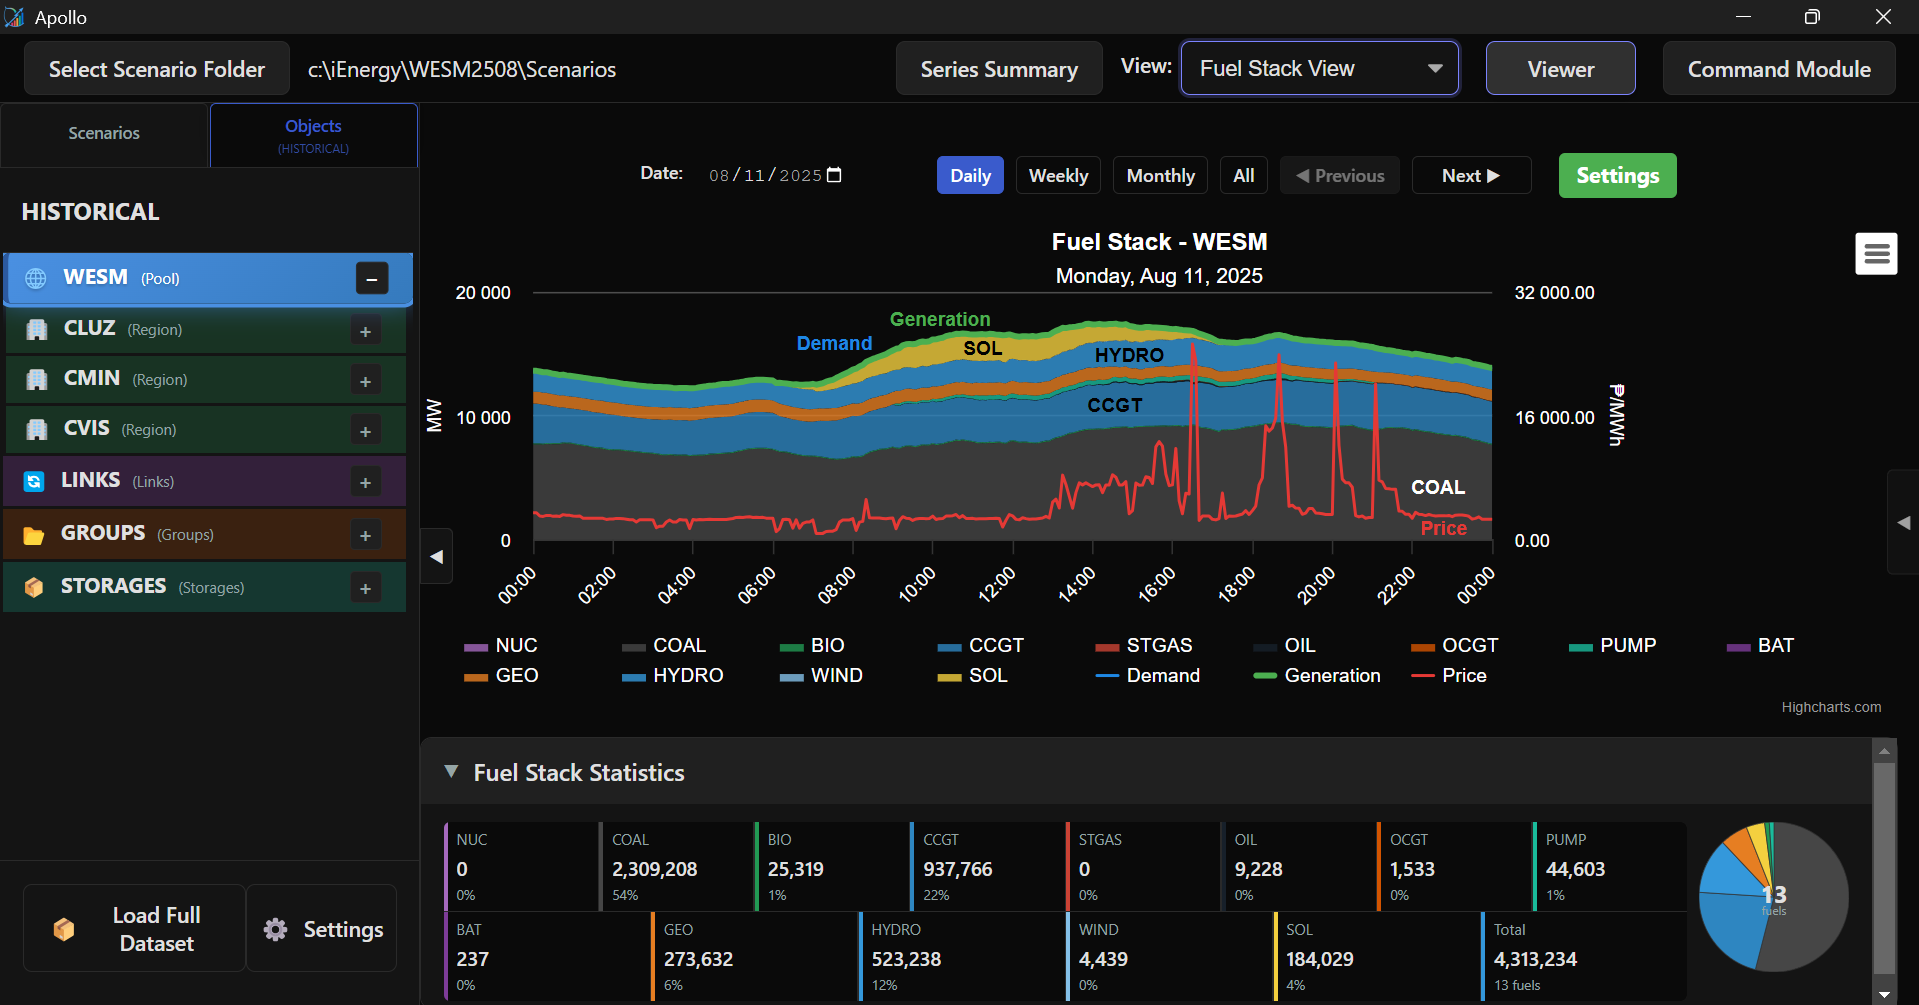
Shows chart for different market parameters such as the supply, demand, fuel stack, and bid stack.
Learn more about different Chart Tabs.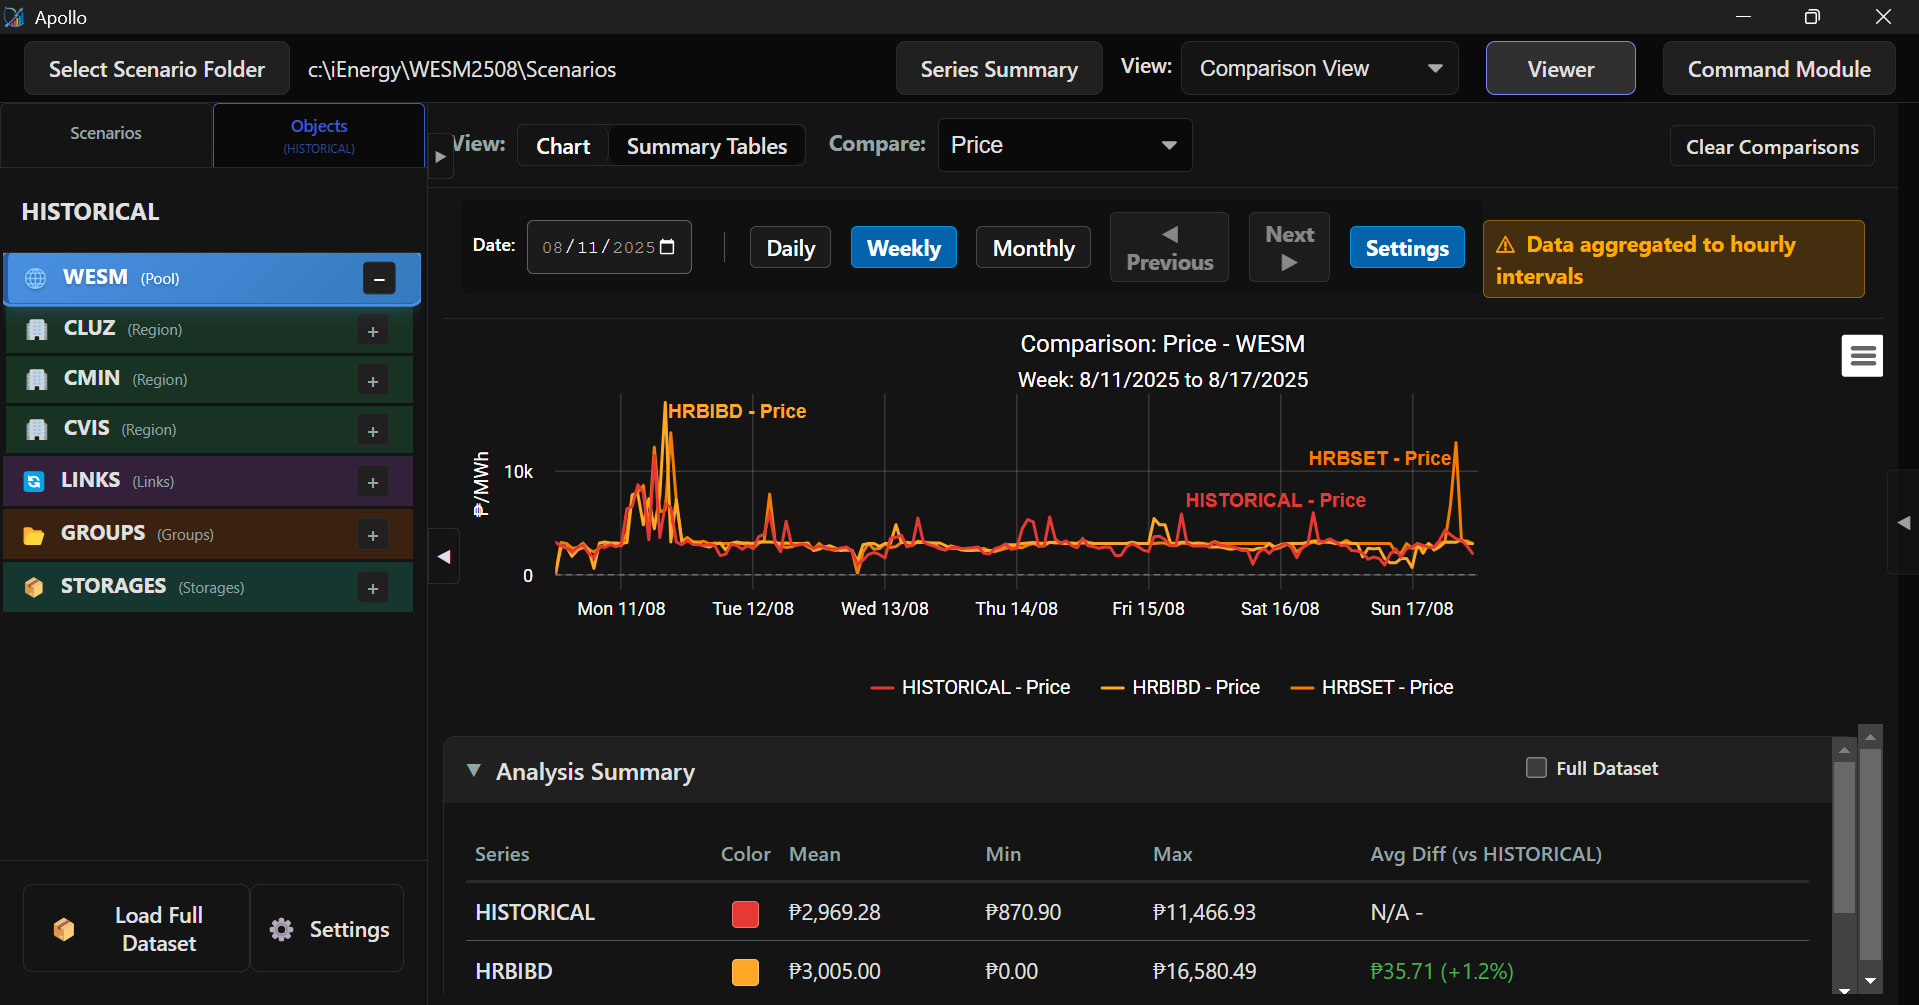
Enables comparison between scenarios' prices, demand and generation.
Learn more about Comparison View.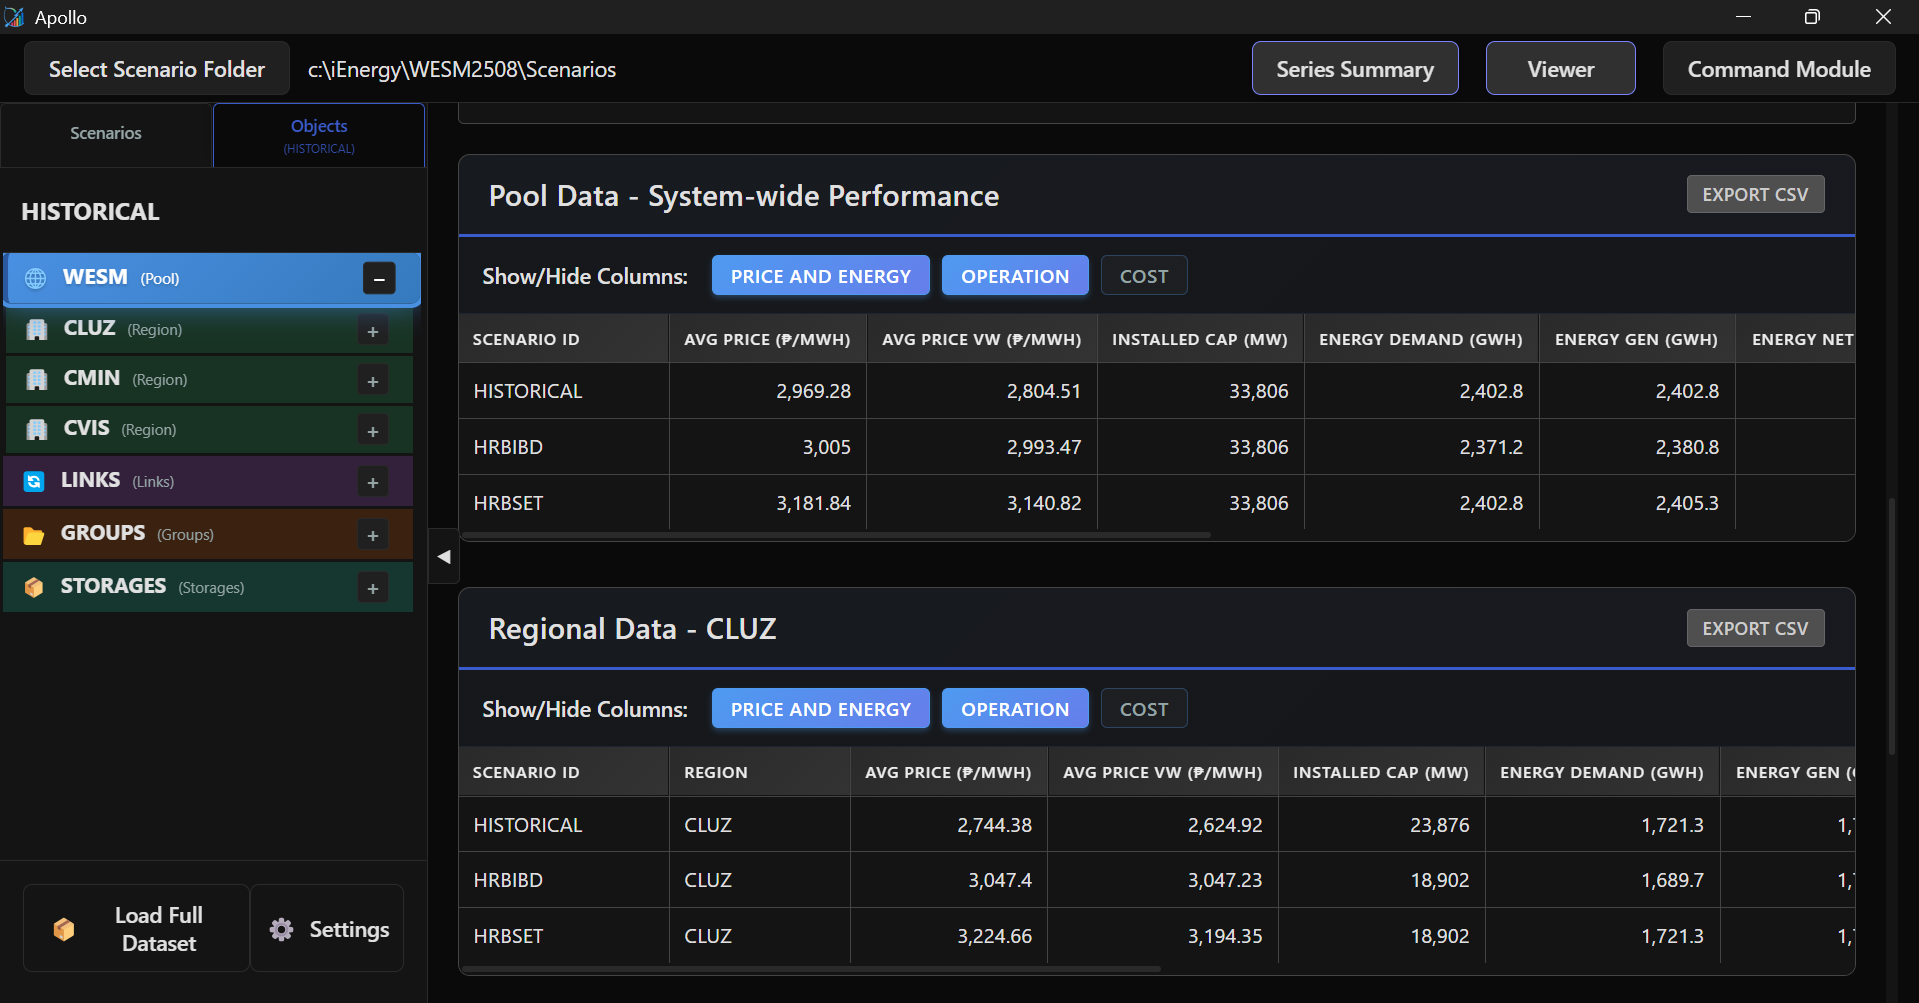
Shows report on the price, energy, costs and other market parameter for easier comparison.
Learn more about Comparison View.